On this page, we'll look at how to enable and use the debug console of the flight code.
The debug console allows you to write debug messages to a serial interface from within the flight code. That can be very useful, for example to find out if a function is called when it's supposed to be called or what the value of a variable is at a given time. For debugging very low level code, the debug console might not be sufficient. For those applications, a hardware debugger can be used (not further described here for now), but for printing out variable values, the debug console should be fine in most cases, and it is reasonably easy to set up.
The debug console can write to:
- a virtual COM port via USB
- a serial (UART) interface (Main Port/Flexi Port)
Enabling an Interface
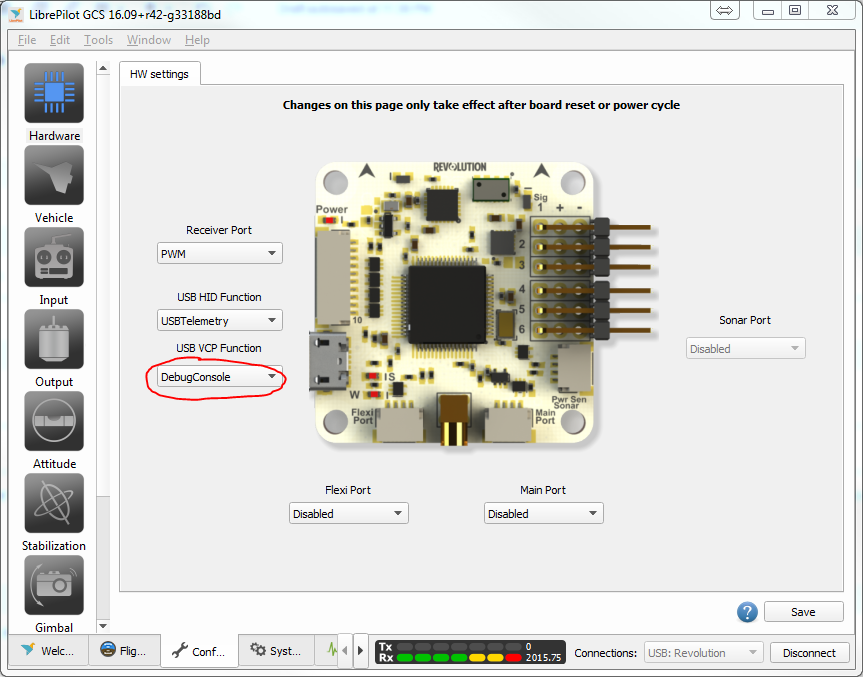
Before writing to the virtual COM port or a UART interface using the debug console, the port has to be assigned to that function in GCS:
- Go to the "Configuration" tab
- Select "Hardware" from the menu on the left
- Choose "DebugConsole" for the port you would like to use (USB is the easiest so set up, Main- or Flexi Port need a USB to serial converter)
Windows CDC/Virtual COM Port Driver
On Windows 8.1 and lower, a driver is needed in order to use the USB virtual COM port. If you have installed GCS using a setup file and checked the option "Install CDC Driver", the driver was installed already.
Otherwise, the driver can be found inside the LibrePilot repository (flight\Project\WindowsUSB\OpenPilot-CDC.inf). To install it, right-click the .inf file and click "Install".
Enabling the Debug Console
To enable the debug console, uncomment the following two lines in flight/targets/<board name>/firmware/inc/pios_config.h:
#define PIOS_INCLUDE_DEBUG_CONSOLE
#define DEBUG_LEVEL 0
You should also set DEBUG_LEVEL to an appropriate value. This constant controls the verbosity of the debug output, you'll see what that means below.
Using the Debug Console
Now that everything is configured, the debug console can be written to using the DEBUG_PRINTF macro:
DEBUG_PRINTF(3, "Hello World.");
The first parameter is the debug level. Only debug messages with levels smaller or equal to DEBUG_LEVEL are printed to the debug console.
The second parameter is the message to send.
DEBUG_PRINTF can be used to send formatted strings as well (hence the 'F' in printf):
uint8_t a_variable = 7;
DEBUG_PRINTF(3, "My variable's value is: %d\r\n", a_variable);
This will print the value of a_variable.
To see the output of DEBUG_PRINTF, you'll need a serial terminal program. Find out what COM port the flight controller is on and connect to it.
On Windows, the OpenPilot Revolution shows up as "Revolution Virtual COM Port" under "Ports (COM & LPT)" in the device manager.